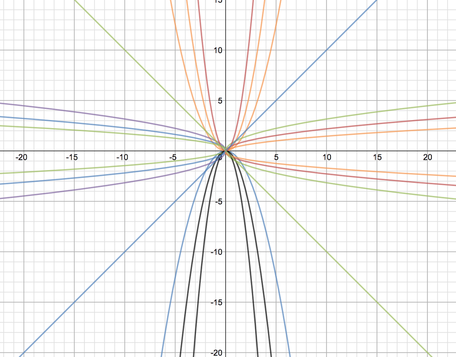
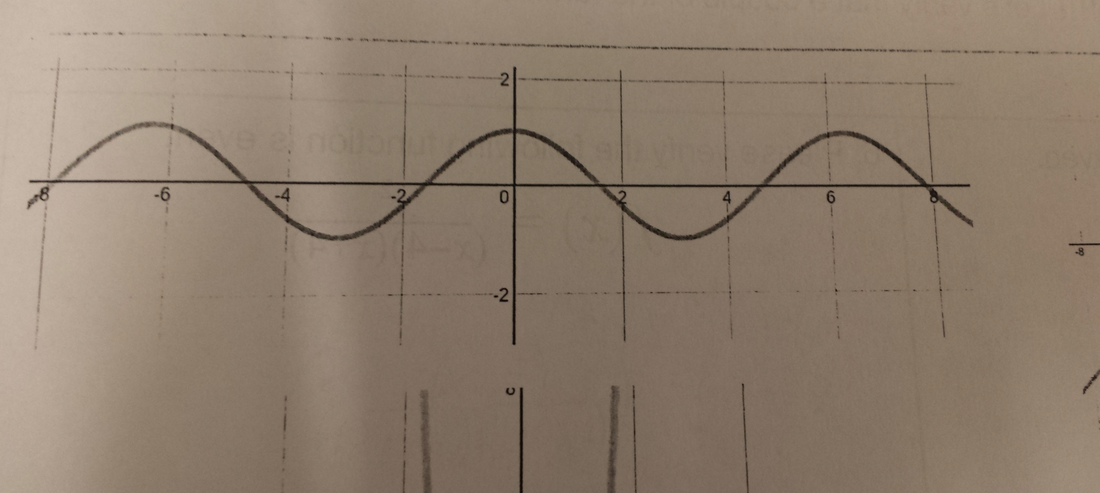
In this graph, I used the equations:
y=x
y=-x
y=ax^2+bx+c----------------Quadratic formula
I knew that the quadratic formula would create a parabola which allowed me to create the lines that are curved along the x and y axis. This specific formula also reflects the parabola over the x and y axis. y=x intercepts y=-x at (0,0). This is also where all of the other equations intercept and where the only zeros are located. Because there are no lines that cross over the x-axis at any other points for example (0,3) there are no zeros. But because they cross over the x axis at (0,0) that is where the only zeros are. As you can tell from looking at the quadratic formula and the equations below, there is no c in the equation. By adding a number in place of c, the parabolas would then move to the right or left of the x-axis. The domain and range of this equation is All real numbers. Because there are no asymptotes and non of the graphed equations end at any point, they go on forever. Therefore making the domain and range of this graph All real numbers
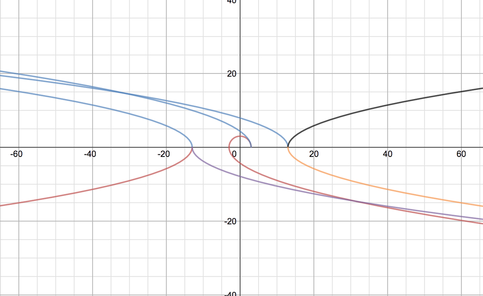
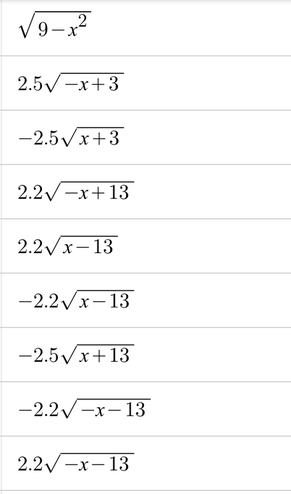
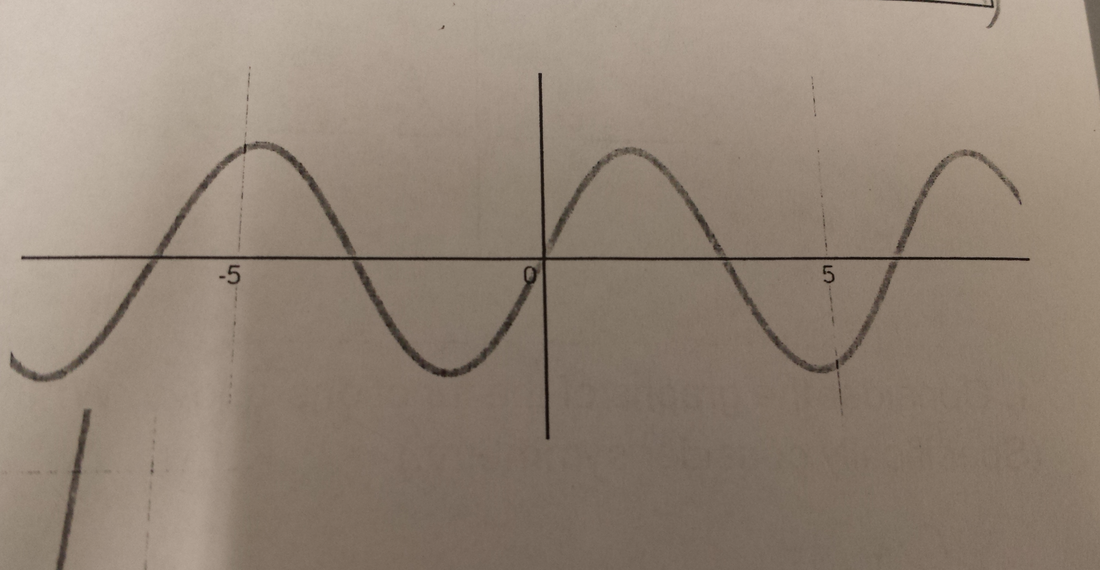
This graph uses the equations of y=The square root of x and the square root of x^2
By having a number after x, it will cause the graph to move to the right or left of the x- axis. To create the half circle at the intersection of the x and y-axis, I used the equation; square root of 9-x^2. Instead of creating a horizontal parabola, I decided to create only what looks like half a parabola and reflect it over the x-axis. This creates that graphed equation to look like a full horizontal parabola. By having a number in front of the square root, it creates the angle of the parabola. If I were to have 5 square root of -x+3, then the decrease of that equation would be much greater. The domain of this graph is All real numbers. This is the same for range. Because there is no equation that stops at any point, this causes the domain and range to be All real numbers. The equations intersect at (-30,15), (-17,0), (3,0), (17,0), (30,-15)
By having a number after x, it will cause the graph to move to the right or left of the x- axis. To create the half circle at the intersection of the x and y-axis, I used the equation; square root of 9-x^2. Instead of creating a horizontal parabola, I decided to create only what looks like half a parabola and reflect it over the x-axis. This creates that graphed equation to look like a full horizontal parabola. By having a number in front of the square root, it creates the angle of the parabola. If I were to have 5 square root of -x+3, then the decrease of that equation would be much greater. The domain of this graph is All real numbers. This is the same for range. Because there is no equation that stops at any point, this causes the domain and range to be All real numbers. The equations intersect at (-30,15), (-17,0), (3,0), (17,0), (30,-15)
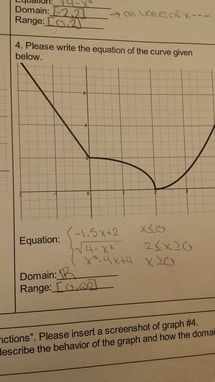
For the graph below, I used the equations of:
the square root of x^2
the square root of x
x^2
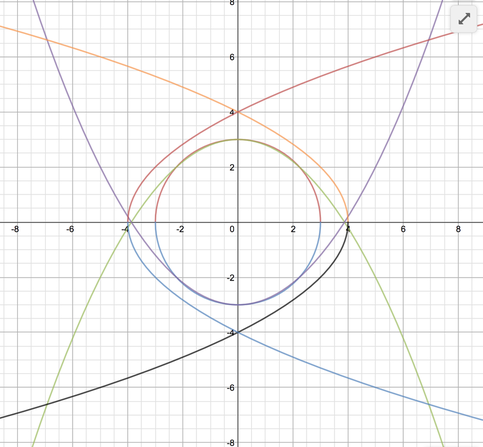
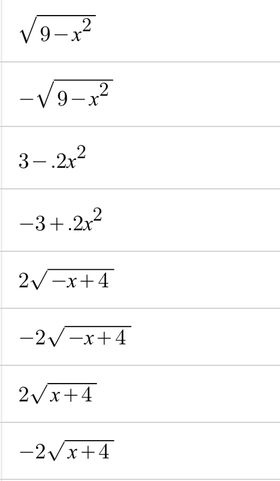
To create the circle in the middle, I used the equation square root of 9-x^2. Then i made the equation negative to reflect it over the x-axis. then, i created a parabola that meets the x-axis at (-4,0) and (4,0) by using the equation 3-.2x^2. i reflected it over the x-axis by making the 3 negative and .2x positive. Again, instead of creating a horizontal parabola, I created half a parabola and reflected it over the x and y- axis to create one parabola. The intersections of this graph are (-4,0), (4,0), (0,-4), (0,4), (0,2),(0,-2), (6.5,6.5),(-6.5,6.5),(-6.5,-6.5),(6.5,-6.5). The domain and range of this graph is All real numbers. Because there is no equation that stops at any time on the graph, it goes on for infinity.
the square root of x^2
the square root of x
x^2
To create the circle in the middle, I used the equation square root of 9-x^2. Then i made the equation negative to reflect it over the x-axis. then, i created a parabola that meets the x-axis at (-4,0) and (4,0) by using the equation 3-.2x^2. i reflected it over the x-axis by making the 3 negative and .2x positive. Again, instead of creating a horizontal parabola, I created half a parabola and reflected it over the x and y- axis to create one parabola. The intersections of this graph are (-4,0), (4,0), (0,-4), (0,4), (0,2),(0,-2), (6.5,6.5),(-6.5,6.5),(-6.5,-6.5),(6.5,-6.5). The domain and range of this graph is All real numbers. Because there is no equation that stops at any time on the graph, it goes on for infinity.
 RSS Feed