7"
14"
21"
For your blog post, please answer the following questions
A. How close was your prediction to the actual graph? If you're graphs were different then why were they
different? What initial reasoning led you to your original graph and why was it different?
B. What do the zeros of your graph represent?
C. How do the three graphs compare in terms of zeros, maximums and minimums? What's similar and
different and why?
D. Consider the slopes of the graphs. When is the graph rising the fastest and what does it mean? When
is it falling the fastest and what does it mean?
E. Please be sure to add an image of your graph(s) and contextualize the blog post for your readers.
A. How close was your prediction to the actual graph? If you're graphs were different then why were they
different? What initial reasoning led you to your original graph and why was it different?
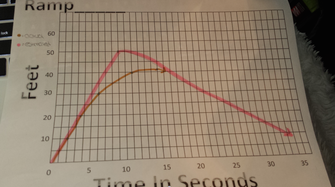
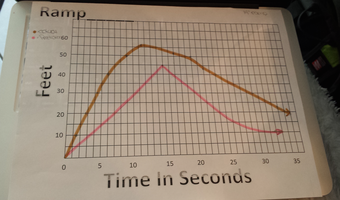
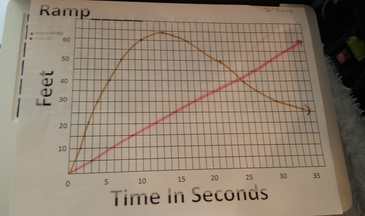
- My prediction was far off of the actual graph. I thought that the 21' graph would go straight up. But instead, it went fast with the longest length of 64 feet in 13.5 seconds then decreased from their. The second graph did the same thing. But my prediction had the graph decreasing speed at 45 feet in 15 seconds. The actual graph was a longest length of 56 feet in 11 seconds and decreased after that. In my third graph, I was alittle bit closer than before. I started with plotting a dot at a length of 50 feet at 9 seconds then decreasing from their. The first 2 plots of my estimated graph were the same as the actual graph. But, the board did not go nearly as far as I thought. I believe that the graphs were different because the higher the board is, the more speed and distance it will get.
B. What do the zeros of your graph represent?
- The zeros of the graph represent the beginning length to the ending length.
C. How do the three graphs compare in terms of zeros, maximums and minimums? What's similar and
different and why?
- The zeros are where they touch the lowest part on the graph which represents the x-axis. The maximums are the highest part that the plot touches of the graph. The minimums are the lowest plots. In the 21' ramp, the zero is 0, The maximum is (13.5, 64). The 14' ramp maximum was (11.5, 56). And the maximum for the 7" ramp was (9,50). The maximum represents the length of the board. The minimum represents the time.
D. Consider the slopes of the graphs. When is the graph rising the fastest and what does it mean? When
is it falling the fastest and what does it mean?
- The graph rises the fastest for the 21" between 0 and 13 seconds.
- The graph rises the fastest for the 14" ramp between 0 and 8 seconds
- The graph rises the fastest for the 7" ramp between 0 and 6 seconds
- This means that the skateboard got the farthest in the shortest amount of time in the given time.
E. Please be sure to add an image of your graph(s) and contextualize the blog post for your readers.
 RSS Feed